The break-even point is the sales volume at which total revenue equals total cost, so profit is exactly zero. One unit below it you lose money; one unit above it you start to earn a profit. Knowing that number before you set a price, sign a lease or launch a product is one of the cheapest ways to test whether an idea can work. This guide explains the arithmetic, walks through the Break-Even Point Calculator with real numbers, and shows how price, variable cost and fixed cost each move the answer.
Note: this is general educational information, not financial or accounting advice. A calculator can only work with the figures you give it.
The formula in three lines
Break-even analysis needs three inputs: fixed costs for a period (rent, salaries, insurance, loan payments), the variable cost of producing one unit (materials, packaging, per-sale fees) and the selling price per unit. From those:
Contribution margin per unit = Price − Variable cost
Break-even units             = Fixed costs ÷ Contribution margin
Break-even revenue           = Break-even units × Price
The contribution margin is the money each sale has left after paying for itself. It is the amount that chips away at your fixed costs, and once those are covered, it becomes profit. You can also express it as a ratio: the margin divided by the price. Break-even revenue is then fixed costs divided by that ratio.
A worked example with the calculator
Take a small business with $10,000 of fixed costs a month, $15 of variable cost per unit and a $25 selling price. Enter those in Fixed Costs, Variable Cost Per Unit and Selling Price Per Unit. The results appear as you type; there is no calculate button. In the optional Go Further card we also entered a Target Profit of 5,000 and Expected / Actual Sales of 1,500 units.
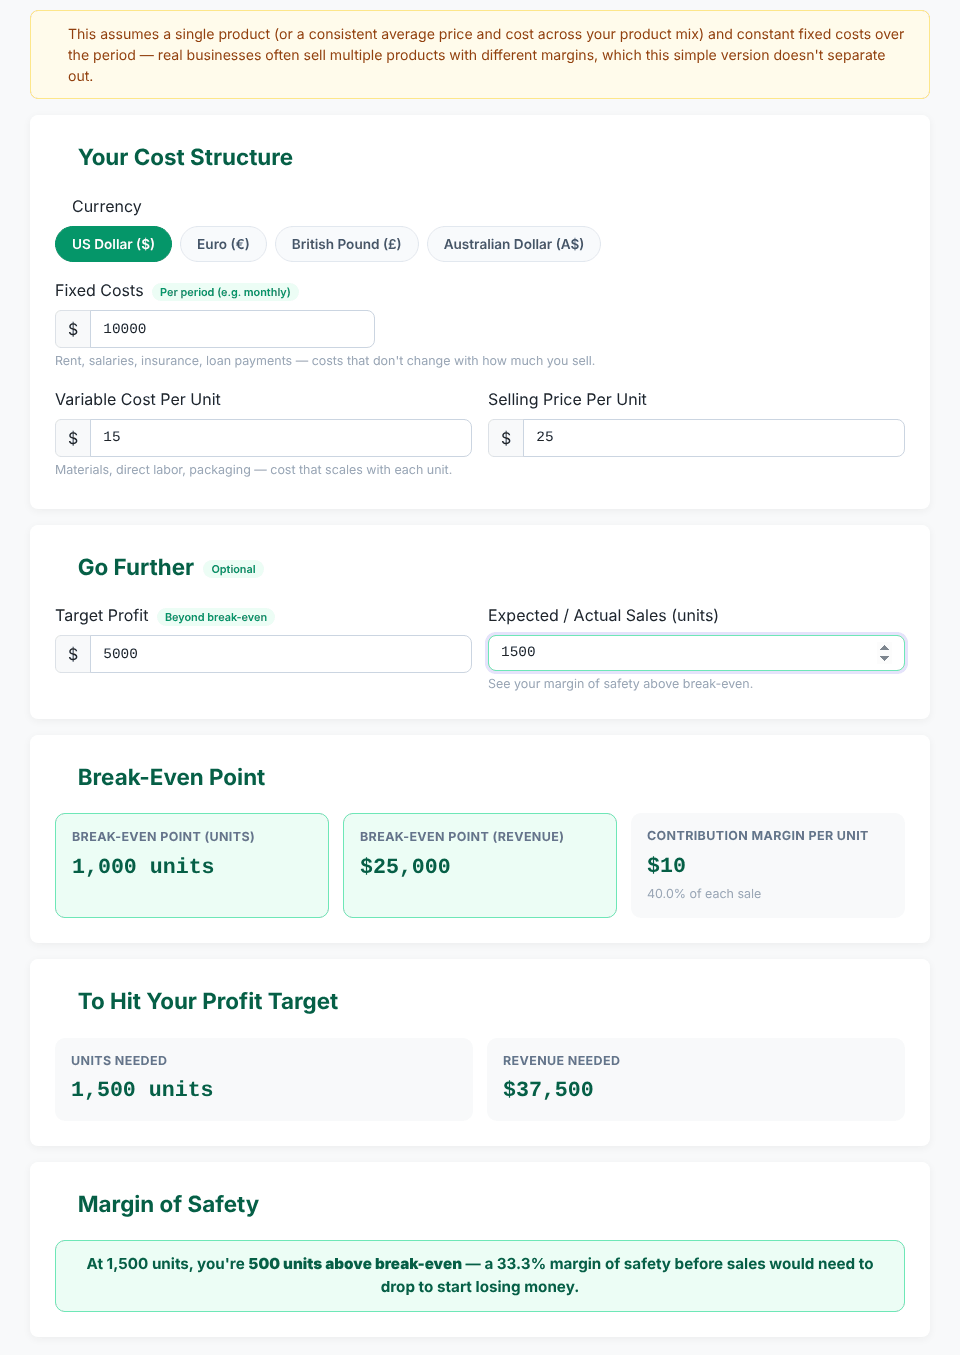
Contribution margin  $10 per unit (40.0% of each sale)
Break-even units     $10,000 ÷ $10 = 1,000 units
Break-even revenue   1,000 × $25 = $25,000
Profit target $5,000 ($10,000 + $5,000) ÷ $10 = 1,500 units, $37,500 revenue
Margin of safety     (1,500 − 1,000) ÷ 1,500 = 33.3%
Check it backwards: at 1,000 units revenue is $25,000 and costs are $10,000 + 1,000 × $15 = $25,000, so profit is zero. At 1,500 units profit is 1,500 × $10 − $10,000 = $5,000. The margin of safety says sales could drop by a third from 1,500 units before the business reaches break-even. Note that the tool measures that cushion against your expected sales, not against the break-even volume.
Test your own prices and costs
Open the Break-Even CalculatorWhich lever matters most?
Holding the other two inputs at the values above, here is what happens when you change one input at a time. Every row was checked in the calculator.
Price (fixed $10,000, variable $15)
$22   →  1,429 units   $31,429 revenue
$25   →  1,000 units   $25,000
$28   →    770 units   $21,538
$30   →    667 units   $20,000
$35   →    500 units   $17,500

Variable cost per unit (price $25)
$12   →    770 units   $19,231
$15   →  1,000 units   $25,000
$18   →  1,429 units   $35,714

Fixed costs (variable $15, price $25)
$8,000   →   800 units   $20,000
$12,000  → 1,200 units   $30,000
Fixed costs scale the answer in a straight line: 20% more fixed cost means 20% more units. Price and variable cost are different because they change the margin you divide by. Cutting the price from $25 to $22 is a 12% cut, but it shrinks the margin from $10 to $7 and raises break-even by 43%, from 1,000 to 1,429 units. Before running a discount, ask whether it can plausibly bring in that many extra customers. The Percentage Discount Calculator and the Profit Margin Calculator are useful companions for that check.
Sorting your costs correctly
The arithmetic is easy. The hard part is deciding what is fixed and what is variable.
- Fixed: rent, salaried staff, insurance, software subscriptions, loan repayments. You owe them whether you sell one unit or a thousand.
- Variable: materials, packaging, shipping you pay per order, commissions, and payment fees.
- Percentage fees: the tool only accepts a flat amount per unit, so convert them. Suppose a payment processor charges a hypothetical 2.9% plus $0.30 per sale. On a $25 item that is $25 × 0.029 + $0.30 = $1.025. Add it to the $15: with a variable cost of 16.025 the calculator gives 1,115 units and $27,855 of break-even revenue, versus 1,000 and $25,000 without the fee.
- Mixed costs: a utility bill with a base charge plus usage, or a salary with commission, should be split into its fixed and variable parts.
Misclassifying a variable cost as fixed makes break-even look lower than it is, because you are leaving cost out of each unit.
Profit targets and the margin of safety
Break-even tells you where you stop losing money. Most people want to know where they start earning what they need. Enter a number in Target Profit and the To Hit Your Profit Target card shows the units and revenue required: fixed costs plus the target, divided by the contribution margin. With our example, a $2,500 target needs 1,250 units and $31,250 of sales, and a $10,000 target needs 2,000 units and $50,000.
The Margin of Safety card compares expected or actual sales with break-even. With the same example, 1,200 expected units gives a 16.7% margin of safety, 1,400 gives 28.6%, and exactly 1,000 gives the message "you're right at break-even". Below break-even the card says how many units short you are and that the volume "would result in a loss". As a rough guide, a thin margin means a modest sales dip could push you into losses; a wide margin gives you room to absorb a bad month.
Another example: a small coffee cart
A cart has $14,000 of monthly fixed costs (staff, pitch fee, loan payment), $1.80 of variable cost per cup (beans, milk, cup, lid) and a $4.50 price. The calculator returns:
Break-even       5,186 units, $23,333 revenue
Margin           60.0% of each sale
Target $6,000    7,408 units, $33,333 revenue
At 5,000 cups    185 units below break-even, a loss
At 6,000 cups    815 units above break-even, 13.6% margin of safety
Over a 30-day month that is about 173 cups a day just to break even and 247 a day to earn $6,000. If you expect to sell 200 cups a day, which is 6,000 a month, the plan clears break-even but with only a 13.6% cushion.
What the calculator assumes and how it rounds
- One product, constant costs. The page itself says it assumes a single product, or a consistent average price and cost across your mix, and constant fixed costs. If you sell several items, use a weighted average. For example, if 60% of units are a $25 item with $15 variable cost and 40% are a $40 item with $22 variable cost, the average price is $31 and average variable cost is $17.80. The tool then gives 758 units and $23,485.
- Units are rounded up; revenue is not. The unit figure uses the next whole unit, but revenue is computed from the unrounded unit count. At a $22 price the tool shows 1,429 units and $31,429, although 1,429 × $22 is $31,438. The difference is small, but do not be surprised by it.
- Money is shown in whole currency units. The contribution margin for the coffee cart is $2.70 but the card shows $3 (the 60.0% beside it is calculated from the exact figure). Calculations use the full decimals, so only the display is rounded. When prices are under a few dollars, do the final check by hand.
- Inputs. Selling price must be above zero and higher than variable cost; otherwise the tool shows an error ("Selling price must be higher than variable cost per unit"), because break-even would be impossible. Negative fixed or variable costs are rejected. A negative target profit is accepted and simply lowers the required units, so leave it blank unless you mean it.
- Currency. You can switch the display between US dollar, euro, British pound and Australian dollar. It changes the symbol only and does not convert amounts.
- Not included: taxes, seasonality, step costs (a second employee after a certain volume), and the time value of money.
The tool runs in your browser. The calculation does not require sending your figures anywhere; the only network request on the page is the feedback form, and only if you submit it.
Quick answers
What period should fixed costs cover? Any period, as long as the target profit and expected sales use the same one. The input is labeled "Per period (e.g. monthly)".
Break-even revenue or units, which should I use? Units suit businesses that sell a countable product. Revenue is easier when prices vary or when you want a sales target for the owner or a salesperson.
How do I lower break-even? Raise the price, cut variable cost per unit, or trim fixed costs. The table above shows that price and variable cost have the biggest effect per percent changed.
Is a break-even result a forecast? No. It tells you the volume you need, not the volume you will get. Pair it with realistic demand estimates, and revisit it whenever your costs change.
Test your own prices and costs
Open the Break-Even Calculator