JSON can nest objects and lists inside each other as deeply as it likes. A spreadsheet is a grid of rows and columns. Converting from one to the other always involves decisions: what becomes a column, what happens to a list, what to do when two records have different fields. This guide explains the decisions our JSON to Excel / CSV Converter makes, shows exactly what ends up in the downloaded CSV and .xlsx files (we opened them and inspected the cells), and covers the cases where you will want to prepare the JSON first.
The flattening rules
The tool turns your JSON into a table with one row per item. It follows a small set of rules, and knowing them lets you predict the result:
- Array of objects: each object becomes a row. This is the usual shape of an API response or a database export.
- Nested object: becomes separate columns with dot notation, so
customer.address.cityis thecityinsideaddressinsidecustomer. - Array of simple values: joined into one cell with commas, so
["gift","express"]becomesgift, express. - Array of objects inside a record: kept as JSON text in one cell, for example
[{"sku":"KB-100","qty":2}]. It is not expanded into extra rows. - Different fields in different records: the columns are the union of all fields, in the order they first appear. A record without a field gets an empty cell.
- A single object: becomes a two-column table headed Key and Value, with the nested fields flattened into the keys.
- A plain list of values: becomes a one-column table headed Value.
How to convert JSON to a table, step by step
- Add your data. Either click Choose File under Upload a .json file (the file is converted immediately) or paste into ...or paste JSON data and click Convert to Table.
- Check the preview. The line above the table shows the size, for example 3 rows • 7 columns.
- Download. Choose Download CSV for a plain text file (
converted-data.csv) or Download Excel (.xlsx) for a workbook (converted-data.xlsx) with one sheet named Sheet1.
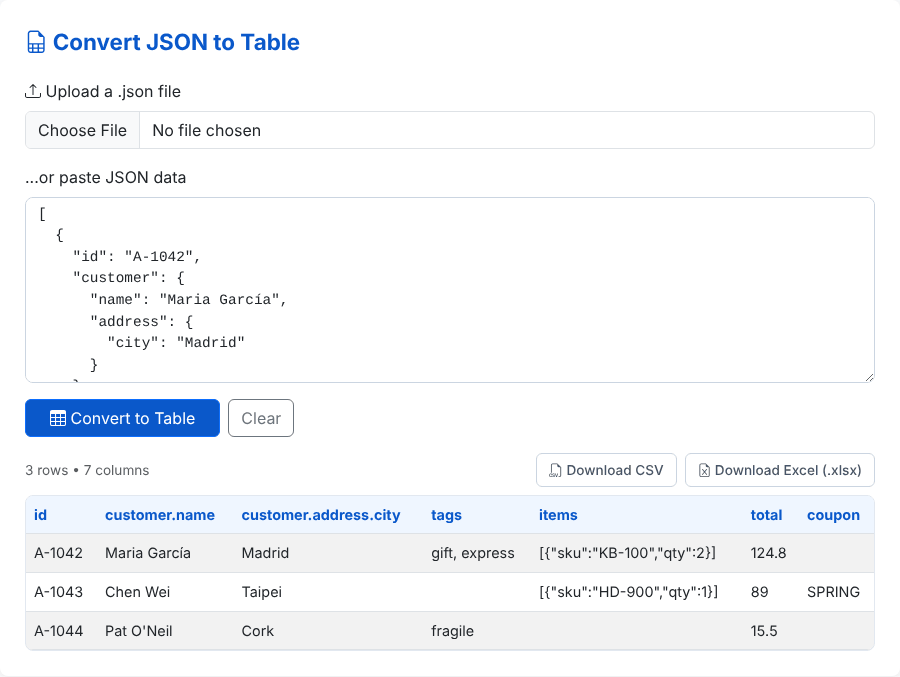
Here is the input behind that screenshot:
[
  {"id":"A-1042","customer":{"name":"Maria García","address":{"city":"Madrid"}},
   "tags":["gift","express"],"items":[{"sku":"KB-100","qty":2}],"total":124.8},
  {"id":"A-1043","customer":{"name":"Chen Wei","address":{"city":"Taipei"}},
   "tags":[],"items":[{"sku":"HD-900","qty":1}],"total":89,"coupon":"SPRING"},
  {"id":"A-1044","customer":{"name":"Pat O'Neil","address":{"city":"Cork"}},
   "tags":["fragile"],"items":[],"total":15.5}
]
The seven columns are id, customer.name, customer.address.city, tags, items, total and coupon. Only the second record has a coupon, so the other two rows leave that cell blank. The second record's empty tags list also becomes a blank cell, and the third record's empty items list becomes blank rather than [].
Lists of objects: the one-row-per-item problem
The rule that surprises people most is the one for a list of objects inside a record. An order with three line items cannot fit into one row as three separate sets of columns without inventing names like items.0.sku, and splitting it into three rows would repeat the order's other fields. The tool does neither: the whole list is written into a single cell as JSON text. That keeps one order per row, but the line items are then text, not columns you can filter or sum.
If you need one row per line item, reshape the data before converting. Take the items array out as its own top-level array, and add the order id to each element so you can still tell which order it belongs to. Then convert that array on its own. The same applies to any one-to-many relationship in the data: convert the parent records and the children as two tables and join them in the spreadsheet with a lookup on the shared ID.
What is inside the CSV and the .xlsx
We downloaded both files from several test inputs and inspected the contents. They are not equivalent.
The .xlsx keeps types. Numbers are stored as numbers (124.8 in the total column is a numeric cell), true and false are stored as real boolean cells, and text is stored as text. Strings that look like numbers stay text: a ZIP code "01234" and a SKU "00123" keep their leading zeros, and an ISO date such as 2026-03-14 stays a text string rather than being converted to a date serial. If you need real dates for sorting or charts, convert the column inside Excel after opening the file.
The CSV is plain text and the spreadsheet decides the types. The CSV file contains 01234 exactly as written. It is when a spreadsheet application opens it that it may decide to drop the zero or turn a value into a date. If that matters, use the .xlsx, or import the CSV through your spreadsheet's text import and mark those columns as text.
Details of the CSV we saw: values containing a comma, a double quote or a line break are wrapped in double quotes, and quotes inside are doubled (He said "hi" is written as "He said ""hi"""). The file uses \n line endings, has no trailing newline at the end, and is UTF-8 without a byte order mark. That last point can matter: Excel for Windows sometimes reads a BOM-less file as a legacy code page, which shows accented characters such as é as garbage. We did not test the file in Excel itself, so treat that as something to check on your machine. If accents look wrong, import via Data > From Text/CSV and choose UTF-8, or download the .xlsx instead, where text is stored as Unicode.
Ready to turn your JSON into a spreadsheet?
Open the JSON to Excel ConverterEdge cases to know about
- Big numbers lose digits. The JSON is parsed with the browser's number type, which is exact only up to 9,007,199,254,740,991. The ID
12345678901234567890came out as12345678901234567000in both files. Numeric IDs this large should be strings in the JSON. Excel itself shows only 15 significant digits for any number. - Formulas in your data. We converted a record whose name was
=HYPERLINK("http://evil.example","click"). In the .xlsx the value is stored as plain text, so Excel does not run it; we opened the file and found no formula cells. In the CSV, any text value that starts with=,+,-or@(or a tab or carriage return) gets a single quote put in front, so that name is written as'=HYPERLINK(...)and LibreOffice opened it as ordinary text instead of running it. The same applies to column headers. Real JSON numbers are left alone:-5stays-5. A text value such as"-5"or a list like[-1, -2]is text, so it receives the quote too; the quote is visible in the cell, and you can remove it in the spreadsheet if you know the value is safe. Text that starts with a space, such as=1+1, is written unchanged. - Dotted keys can collide. The record
{"a.b":1,"a":{"b":2}}has two values that both want the columna.b. Both values are kept: the first keeps the namea.band the second gets the columna.b_2(a third would bea.b_3), so check the headers if you see a suffix like this. - Empty objects disappear.
{"a":{},"b":[],"c":""}produced only columnsbandc. An empty object creates no column at all, while an empty list or empty string gives a blank cell. - Mixed arrays collapse to one column. If a top-level list contains anything that is not an object, for example
[{"a":1},null,{"a":2}]or[{"a":1},5], the whole list becomes a single Value column in which each object is JSON text. - Nulls become blanks. A
nullvalue is an empty cell, so you cannot tell it from an empty string afterwards. In a list of simple values,[1,null,3]becomes1, , 3. - An empty result gives a message. An empty list
[]shows No data found to convert (the JSON is an empty array). The same message appears for[{}], where the array is not actually empty but contains nothing to turn into columns. The input{}shows an empty table with 0 rows and 2 columns.
When the conversion fails
Invalid JSON shows Invalid JSON: followed by your browser's parser message, for example Unexpected token ']', "[{"a":1},]" is not valid JSON for a trailing comma. If you click Convert to Table with nothing in the box, you get Please upload a file or paste some JSON data first. The usual causes of invalid JSON are covered in our JSON Formatter guide.
An uploaded file is read as UTF-8 text. A leading byte order mark is handled; we loaded a file that began with one and it converted normally. A file saved in an older single-byte encoding will show replacement characters (�) in place of accented letters, so re-save it as UTF-8 first.
File size and speed
The table preview is drawn on the page in full, with every row, and that is the slowest part. In our test browser a 5,000-row array (about 337 KB of JSON) was previewed in roughly 1.6 seconds, 20,000 rows (1.4 MB) in about 8 seconds and 100,000 rows (7 MB) in about 25 seconds. The .xlsx for 100,000 rows was 18 MB and was generated in about 4 seconds. Your times will depend on your computer. Treat tens of thousands of rows as the practical comfort zone, and for bigger exports use a script or a command-line tool. Excel itself stops at 1,048,576 rows per sheet.
Where your data goes
We watched the network while converting pasted JSON, loading a file and downloading both formats: the tool made no requests after the page had loaded. Parsing, flattening and building the table all run in your browser. The .xlsx is written by the SheetJS library, which the page loads from a public CDN (jsDelivr) when it opens. That has one practical consequence: if that library cannot be loaded, because you are offline or a content blocker stops it, clicking the Excel download shows the message Excel export needs the SheetJS library, which could not be loaded. Check your connection or use CSV. above the results, while the table and the CSV download keep working. The page can also show third-party advertising. Neither the library nor the ads receive your JSON from our code, but remove personal data you do not need to share, as with any website.
Quick answers
Can I convert a CSV back into JSON? This tool goes one way. You can inspect a CSV with the CSV Viewer, and the JSON to HTML Table tool shows JSON as a sortable table on screen.
Can I choose which columns to export or rename them? No. All columns are exported, named after their path. Rename headers in the spreadsheet afterwards.
Is there more than one sheet or any formatting? No. There is one sheet named Sheet1, with no styling or column widths set.
Does it keep the column order from my JSON? Yes, in order of first appearance across the records, with one exception: keys that look like whole numbers are listed first in ascending order because of how JavaScript orders object keys.
Ready to turn your JSON into a spreadsheet?
Open the JSON to Excel Converter